If you've learnt Power BI organically and developed your skills using 'real world' applications you've probably learnt a couple of things the hard way. One thing I realised on my journey with PowerBI was that its very easy to create many measures and then end up with a model that’s difficult to manage and maintain. Initially, I would create measures and place them in the table that felt like the best place to store them, this worked for a while but inevitably didn’t quite work. I also tried putting a 'special' character at the start of the name, in my case a # symbol, to easily differentiate a measure from a column, this also didn’t quite work. After doing some research, I found the best solution to this issue was to create a Measures table and put all of my measures in this table. In this post, I'll show you how I created the measures table.
There are a couple of methods to create a measures table, the most obvious one is to create a 'table' using excel or notepad and then import this into the data model and then store all the measures within this table. This is fine but there are easier methods.
Creating a table using 'Enter Data'
In the Power BI ribbon there is a button labelled 'Enter data' with tooltip 'Create a new table by typing or pasting in new content'. This option allows you to type or paste data into a new table that is then submitted to the data model. It's an (almost) a one-shot process where the data is entered and then available in the model.
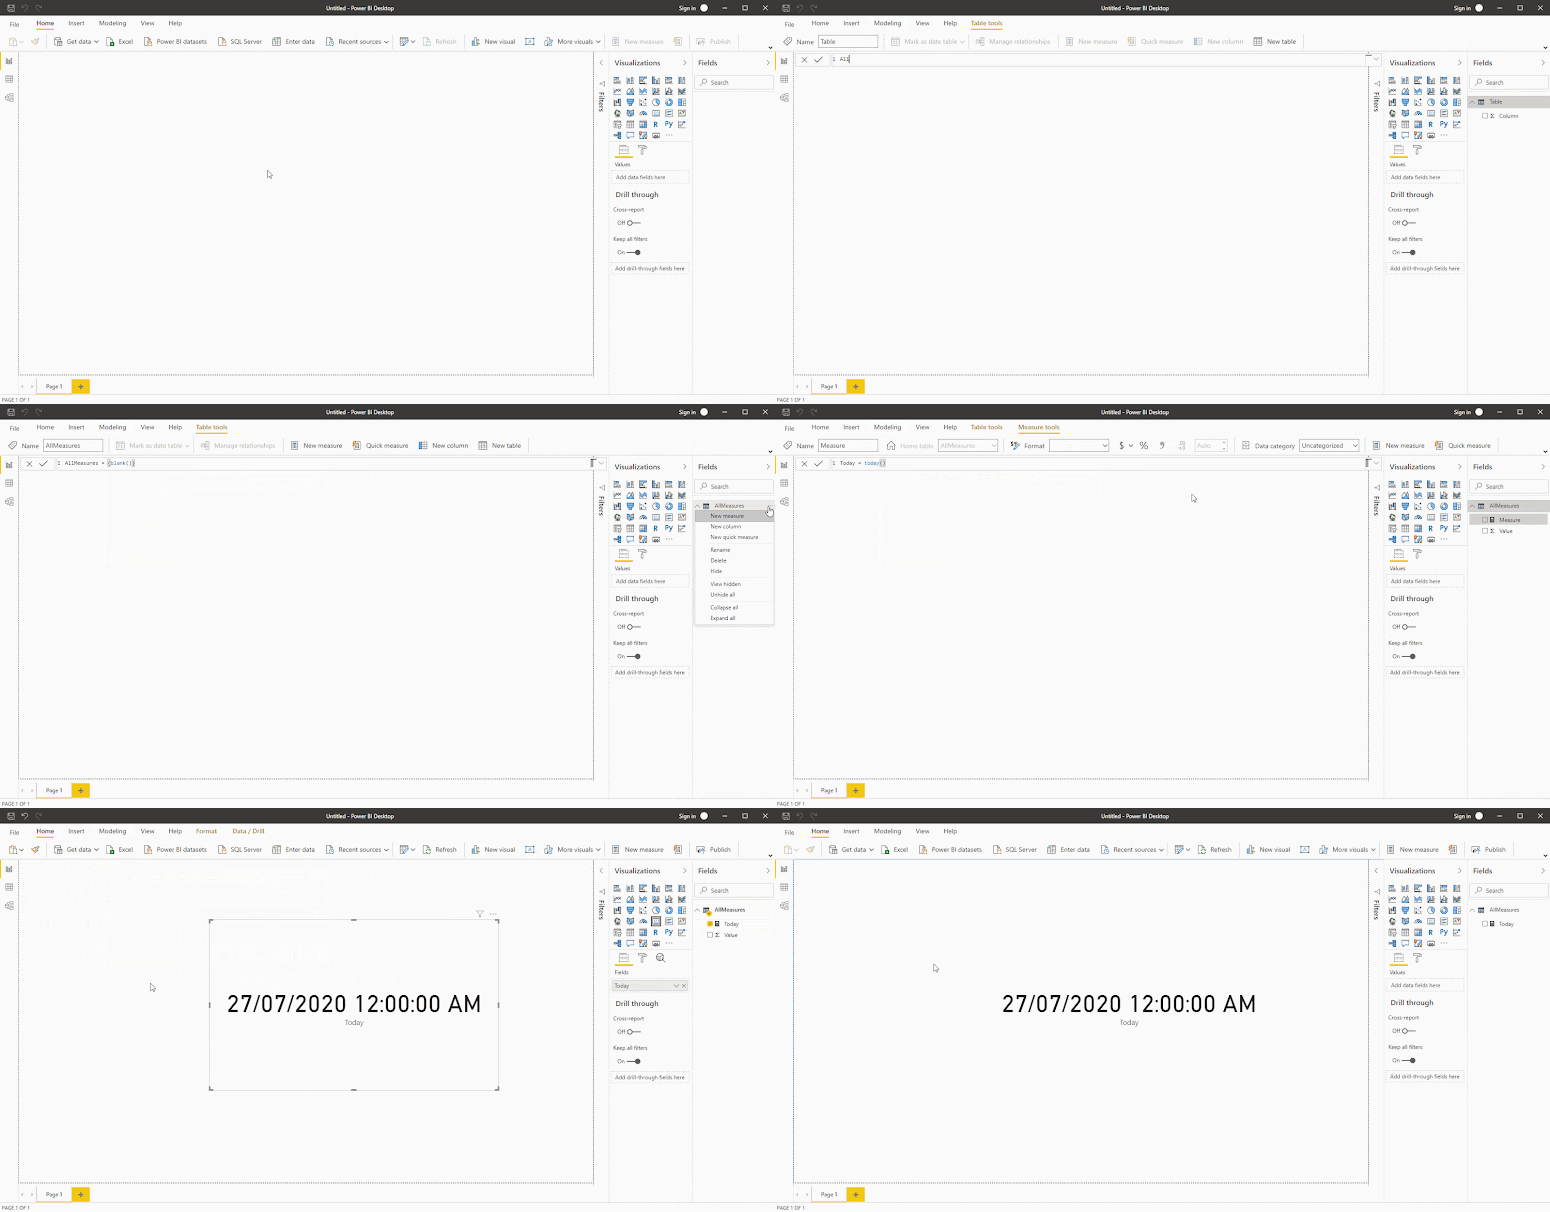
If you click this button it'll display a simple interface which will allow you to type (or paste) some data. For the purpose of creating a new table to host measures, the only required pieces of information are a column title and a table name. I'd suggest changing the table name to 'AllMeasures' and the column name to 'blank'. Once you've done this, click 'Load' and after a short moment, you'll see the new table available in the fields pane in the Power BI window.
Creating a table using DAX
My preferred method is one that I discovered from Phil Seamark from the Customer Advisory Team at Microsoft when he tweeted about it some time back. I'd recommend checking out his Twitter feed for some great PowerBI related content!
The method is to create a new table using a single line of DAX via the 'Modeling' then 'new table' links in the ribbon. Once you've clicked this the formula editor text bar will appear and you'll need to enter the following line of DAX code.
AllMeasures = {Blank()}
This will now create a new table called 'AllMeasures' that you can add additional measures to.
There are a couple of things to note with this method
- If you want your table to appear at the top of the field list, you can add a space to the start of the tble name.
- If you want to title your table Measures this is possible by using square brackets before and after the table title, i.e. [ Measures]


factorial hundred In the last few days, the “factorial of 100” is one of the top subjects and a lot of maths geeks compute it using voice assistants such as Alexa, Shiri, etc.
ReplyDeleteauto-accident-compensation-claims-in-michigan When needing to hire a car accident lawyer, you want someone you can trust to see your case through to the end.
car-accident-lawyer-san-fernando-valley When needing to hire a car accident lawyer, you want someone you can trust to see your case through to the end.
factorial hundred In the last few days, the “factorial of 100” is one of the top subjects and a lot of maths geeks compute it using voice assistants such as Alexa, Shiri, etc.
eiffel tower macau Aurecon was involved in the design and design of the unique new structure. We provided complete structural engineering advice for the project and assisted with keeping the original design.
car-accident-lawyer-columbus-ga Although the aftermath of a car accident may only last for a second, the physical, financial, and emotional consequences of a wreck can last for the rest of your life.